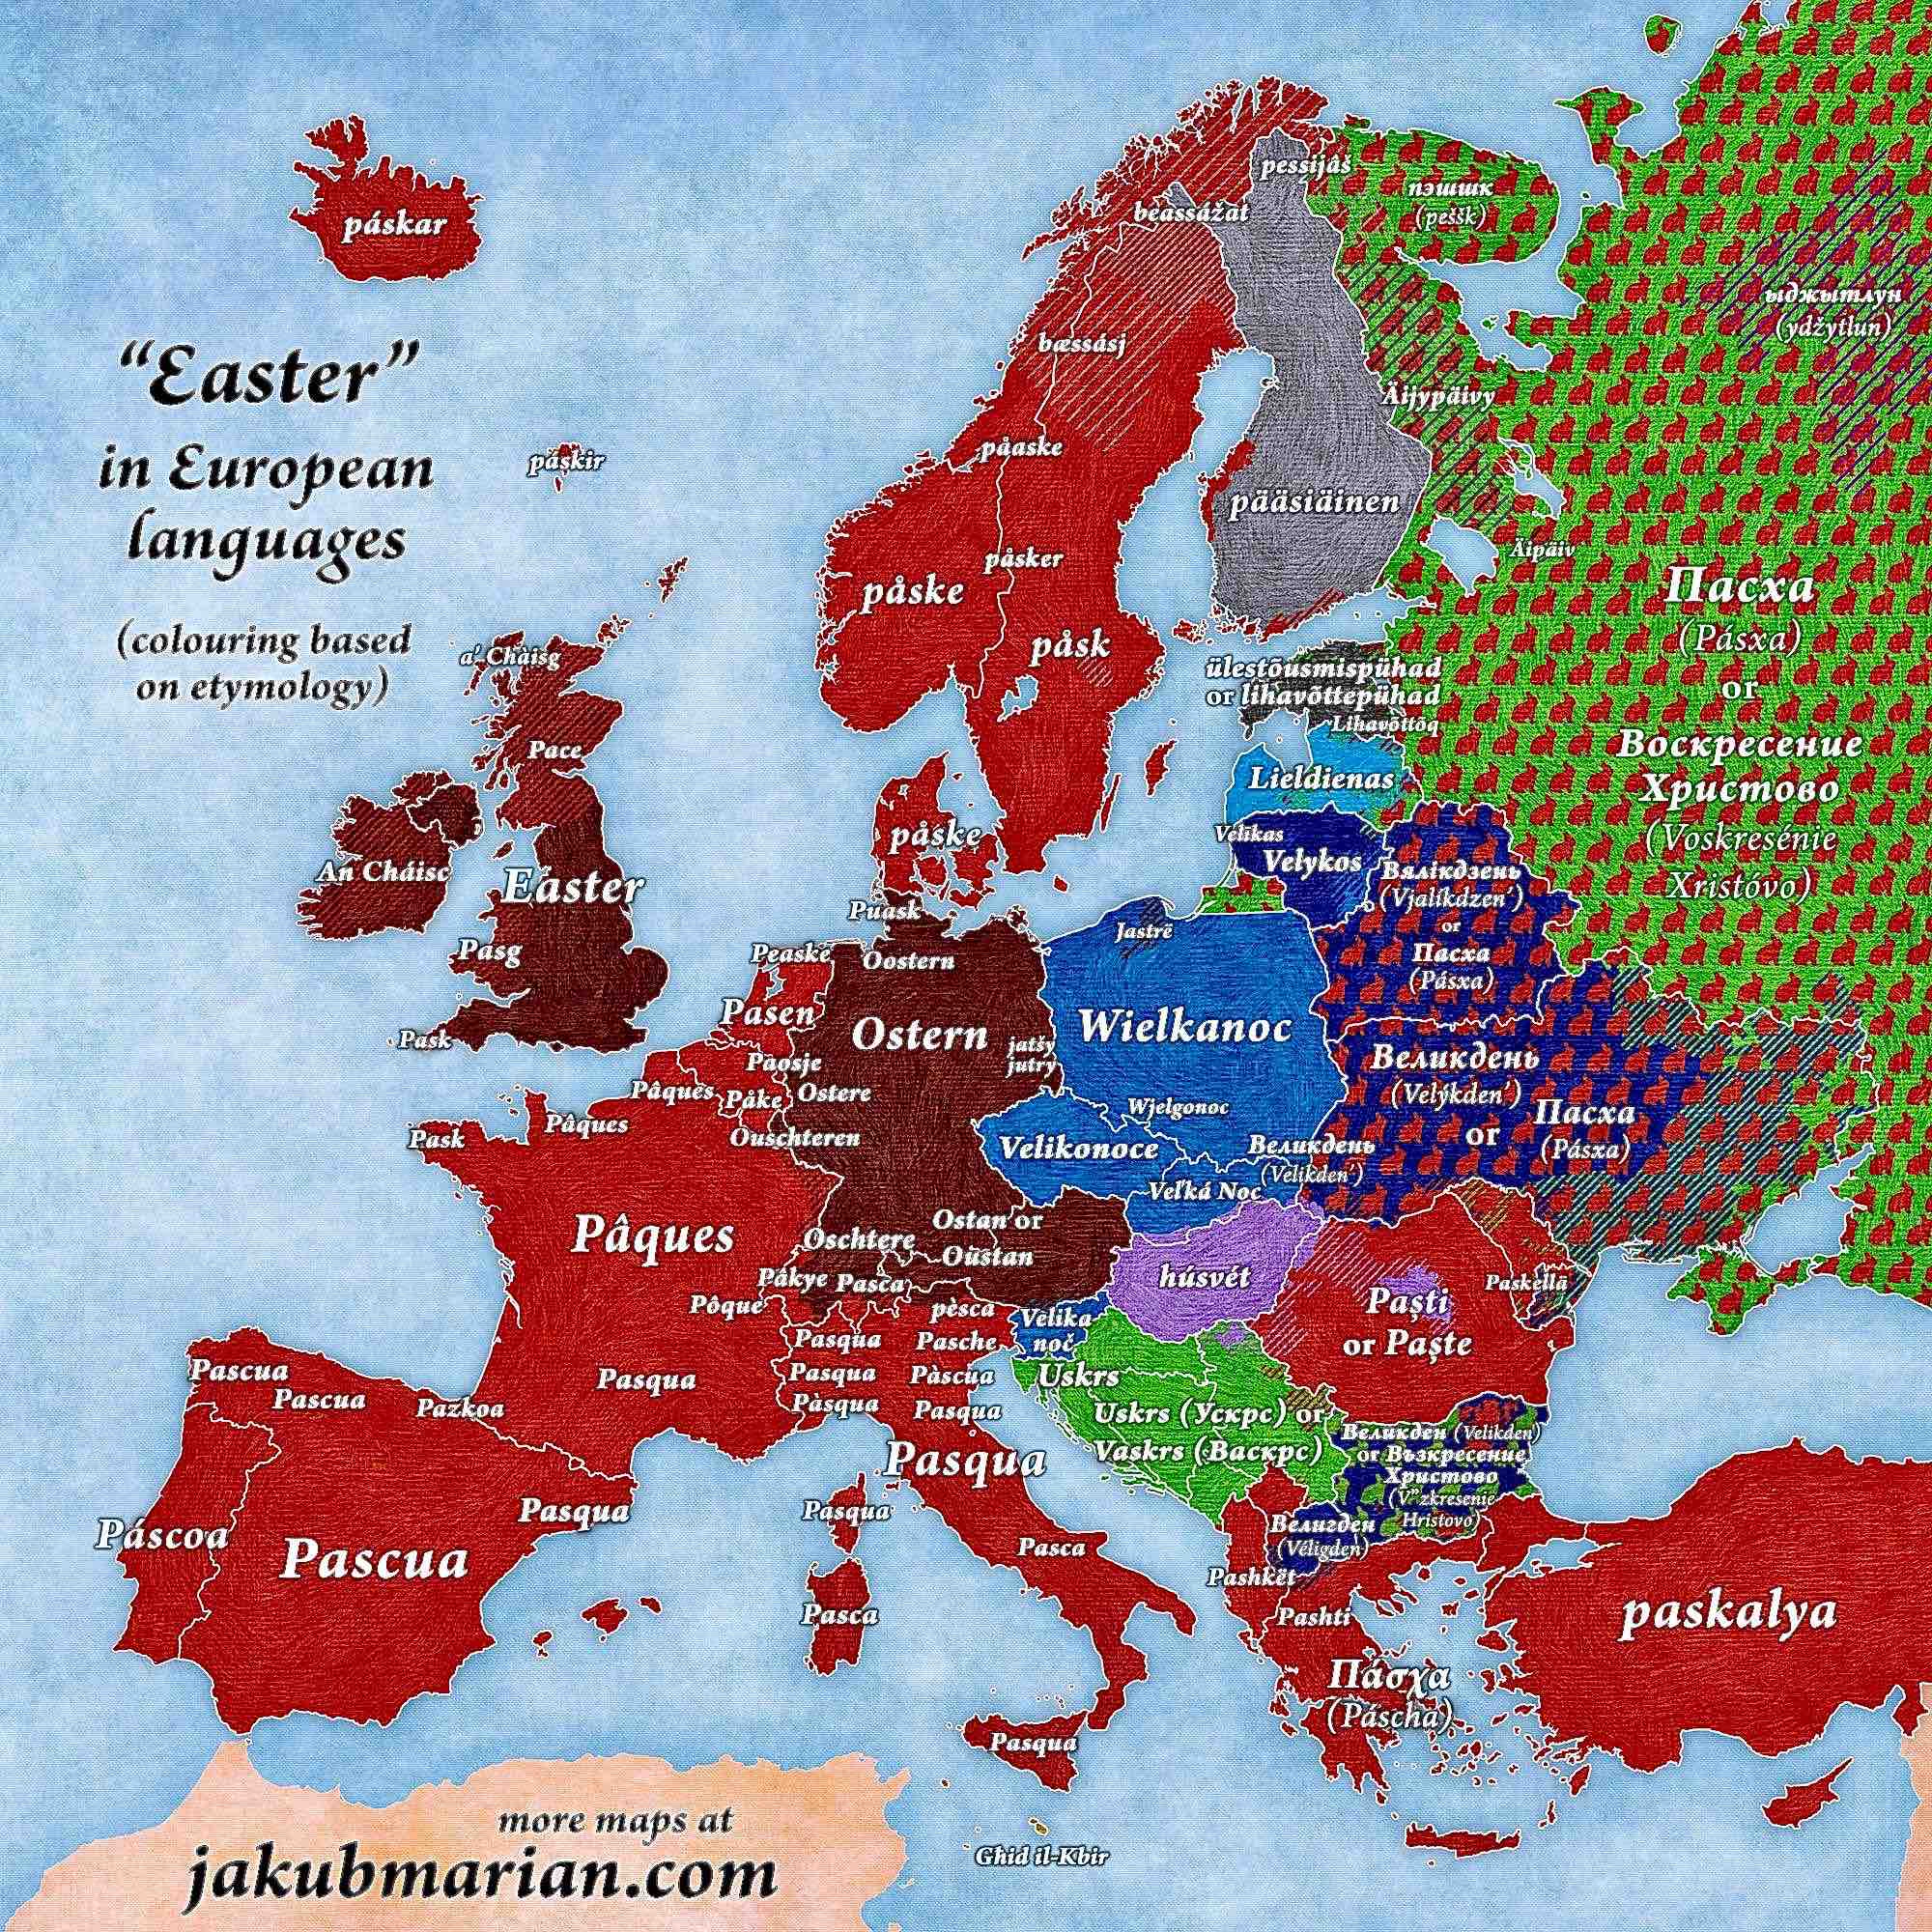
‘Easter’ in European Languages
One thing I love about Europe is its language diversity. The table below is based on data of spoken languages in the European Union. The list has no ranking, but English is the most useful language in the EU with its 51 per cent.
| Language | Native | Additional | Total |
|---|---|---|---|
| English | 13% | 38% | 51% |
| Russian | 1% | 5% | 6% |
| German | 18% | 14% | 32% |
| Catalan | 1% | 1% | 2% |
| French | 12% | 14% | 26% |
| Arabic | 1% | 1% | 2% |
| Italian | 13% | 3% | 16% |
| Tamil | 1% | 0% | 1% |
| Spanish | 8% | 7% | 15% |
| Turkish | 1% | 0% | 1% |
| Polish | 8% | 1% | 9% |
| Galician | <1% | 0% | <1% |
| Romanian | 5% | 0% | 5% |
| Basque | <1% | 0% | <1% |
| Dutch | 4% | 1% | 5% |
| Scottish Gaelic | <1% | 0% | <1% |
| Hungarian | 3% | 0% | 3% |
| Luxembourgish | <1% | 0% | <1% |
| Portuguese | 2% | 1% | 3% |
| Welsh | <1% | 0% | <1% |
| Greek | 2% | 1% | 3% |
| Chinese | <1% | 0% | <1% |
| Swedish | 2% | 1% | 3% |
| Hindi | <1% | 0% | <1% |
| Czech | 2% | 1% | 3% |
| Urdu | <1% | 0% | <1% |
| Bulgarian | 2% | 0% | 2% |
| Slovak | 1% | 1% | 2% |
| Danish | 1% | 0% | 1% |
| Finnish | 1% | 0% | 1% |
| Croatian | 1% | 0% | 1% |
| Lithuanian | 1% | 0% | 1% |
| Slovene | <1% | 0% | <1% |
| Estonian | <1% | 0% | <1% |
| Irish | <1% | 0% | <1% |
| Latvian | <1% | 0% | <1% |
| Maltese | <1% | 0% | <1% |